InfectionRank and VirusWeather
A worldwide COVID-19 risk rating updated daily: infection risk on a 10-step scale, reproduction rate and trends for 4,500+ local areas, published as daily reports on infectionrank.org.
Overview
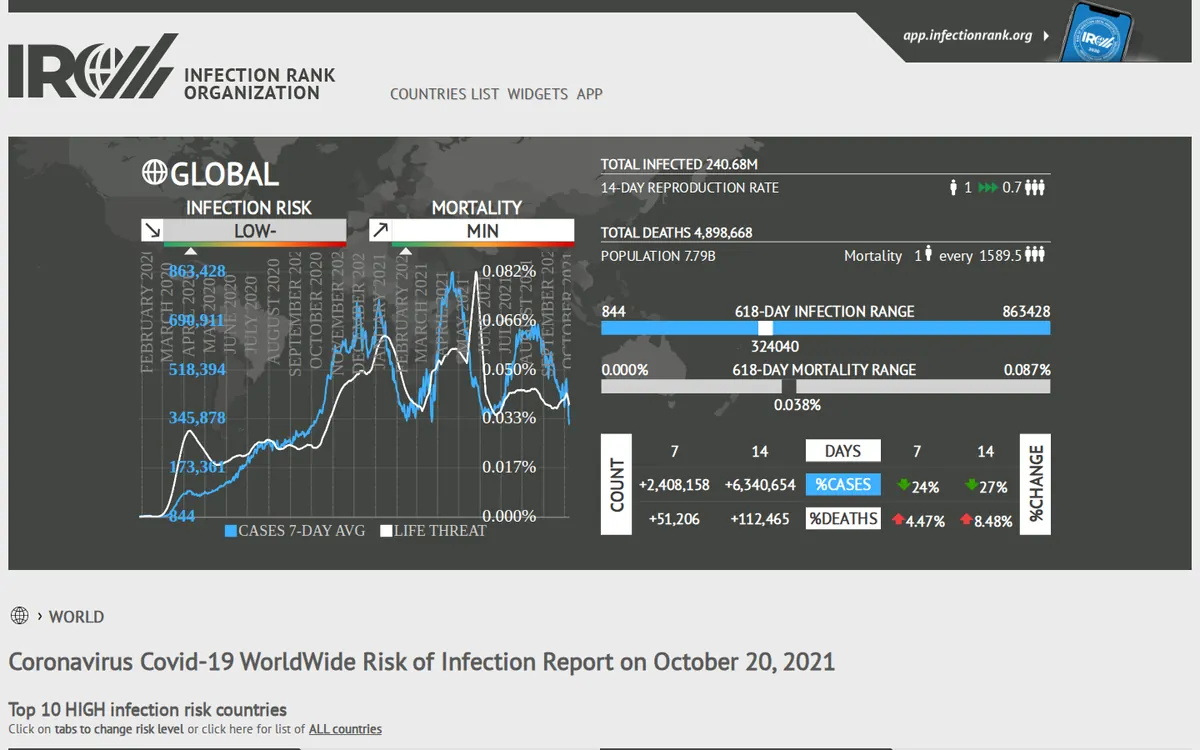
InfectionRank was a public COVID-19 rating service. Every day it published a worldwide Risk of Infection Report on infectionrank.org: global totals, a 14-day reproduction rate, 7 and 14-day case and death trends, and countries ranked by infection risk and by mortality, each on a 10-step scale from min to high+. Day-by-day history for each location went back to January 2020.
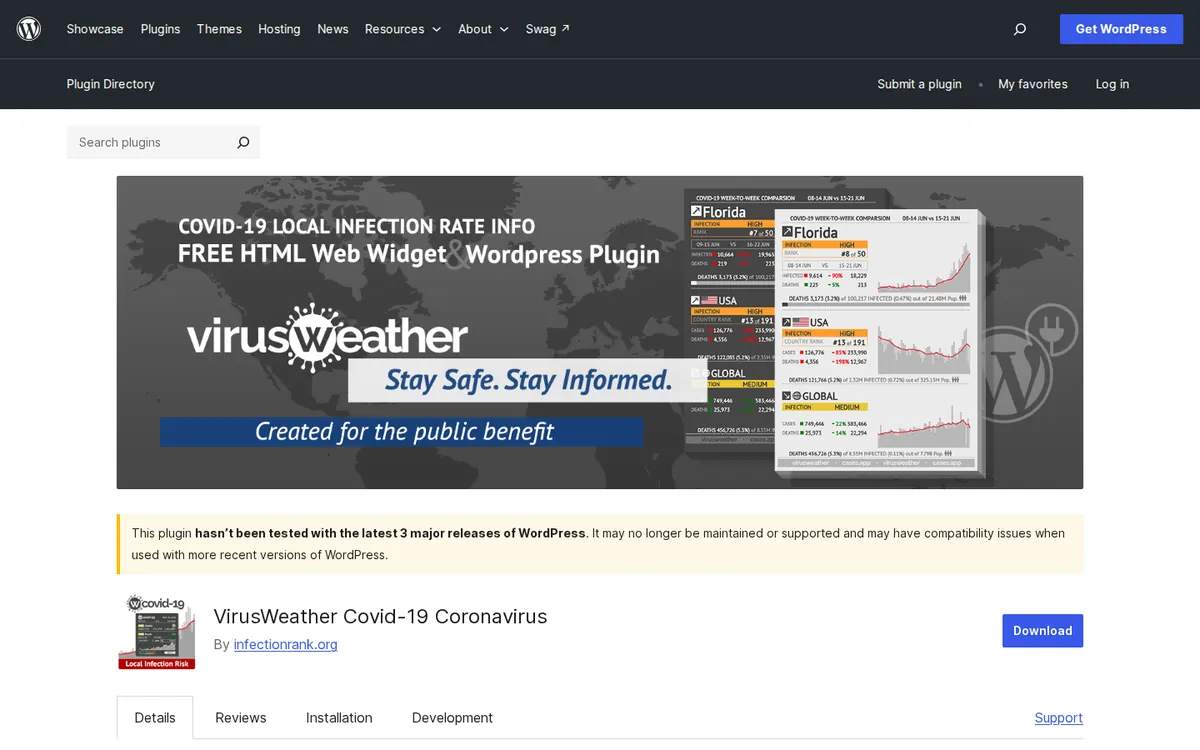
VirusWeather took the same rating to other websites. A widget wizard produced a ready-to-paste snippet for a fixed location, or a dynamic version that picked the nearest area from the visitor's IP address. The widget itself was a PNG image with no JavaScript, in square, basic, advanced and horizontal banner layouts with light or dark themes. A free web app followed several locations at once, and a plugin in the official WordPress directory brought the widgets into WordPress.
The plugin was added to WordPress.org in May 2020 and reached version 2.0.3 that October, gaining shortcodes, a built-in widget generator and deep links to each location's full history. The last daily report is dated October 20, 2021; archived copies of the homepage from late 2021 and 2023 still show it. The site is offline now, and the plugin is still listed.
What was built
- Daily report pages for the world and for each country, with the full day-by-day data embedded in the page and a dated archive folder for every report.
- A risk model that gives each location an infection threat level and a separate mortality level on a 10-step scale, plus trend direction, a this-week versus last-week case comparison and global and in-group rankings.
- Country rankings in high, medium, low and min tabs, a list of all countries, and drill-down pages to state and region level.
- A widget wizard on infectionrank.org with fixed location or automatic IP geolocation, four layouts, light and dark themes, live preview and copy-ready HTML or WordPress code.
- PNG widgets addressed by country, state, county, layout and theme in the image URL, so a host site embeds nothing but an image tag and a link.
- The VirusWeather WordPress plugin: a sidebar widget, a [virusweather] shortcode with country, state and county attributes, and an admin generator page with a searchable location picker covering 190 countries.
- The Infection Rank web app for following several locations at once, with basic and advanced views, light and dark themes and a web app manifest.
Stack
Frontend
- Vanilla JavaScript
- Rendered each daily report from the JSON data embedded in the page
- jQuery
- Widget wizard, location selection and modals on the widget page and web app
Backend
- Daily data pipeline
- Collected case and death counts every day, stamping each record with source URL and scrape time
- Risk scoring algorithm
- Threat and mortality levels, trend rates and global and in-group rankings per location
- Static report generation
- A dated set of report pages per day for the world, countries and regions
- PNG widget rendering
- Widget images per location, layout and theme, rendered large (1000 pixels square) for sharp scaling
- IP geolocation
- Dynamic widgets showed the nearest available area for each visitor's IP address
Data
- Public health sources
- Widget page credits CDC, WHO, ECDC and Wikipedia; snapshot records also cite the Bing COVID-19 tracker
Infrastructure & DevOps
- Cloudflare
- Served the Infection Rank web app for following several locations at once
Integrations & Payments
- Google reCAPTCHA
- Protected the widget wizard on infectionrank.org against automated abuse
CMS & Commerce
- WordPress plugin (PHP)
- Widget, shortcode and admin generator, published in the official WordPress.org plugin directory
Engineering highlights
No JavaScript on the host site: a widget is a single image tag, compatible with any theme and, per the plugin FAQ, collecting nothing about the site or its visitors.
Widget images are produced at high resolution (the square layout at 1000 pixels) and scaled down in the page, so they stay sharp on Retina screens at display sizes from 250 to 600 pixels.
Every daily record kept its provenance, a source URL and the time it was scraped, next to the computed levels and rankings.
Each widget deep-links to its location's full history back to the start of the pandemic, added in plugin version 2.0.2.